A research group at MOX has been active during the past year in the development of epidemiological models for the analysis and forecast of the COVID-19 epidemic in Italy.
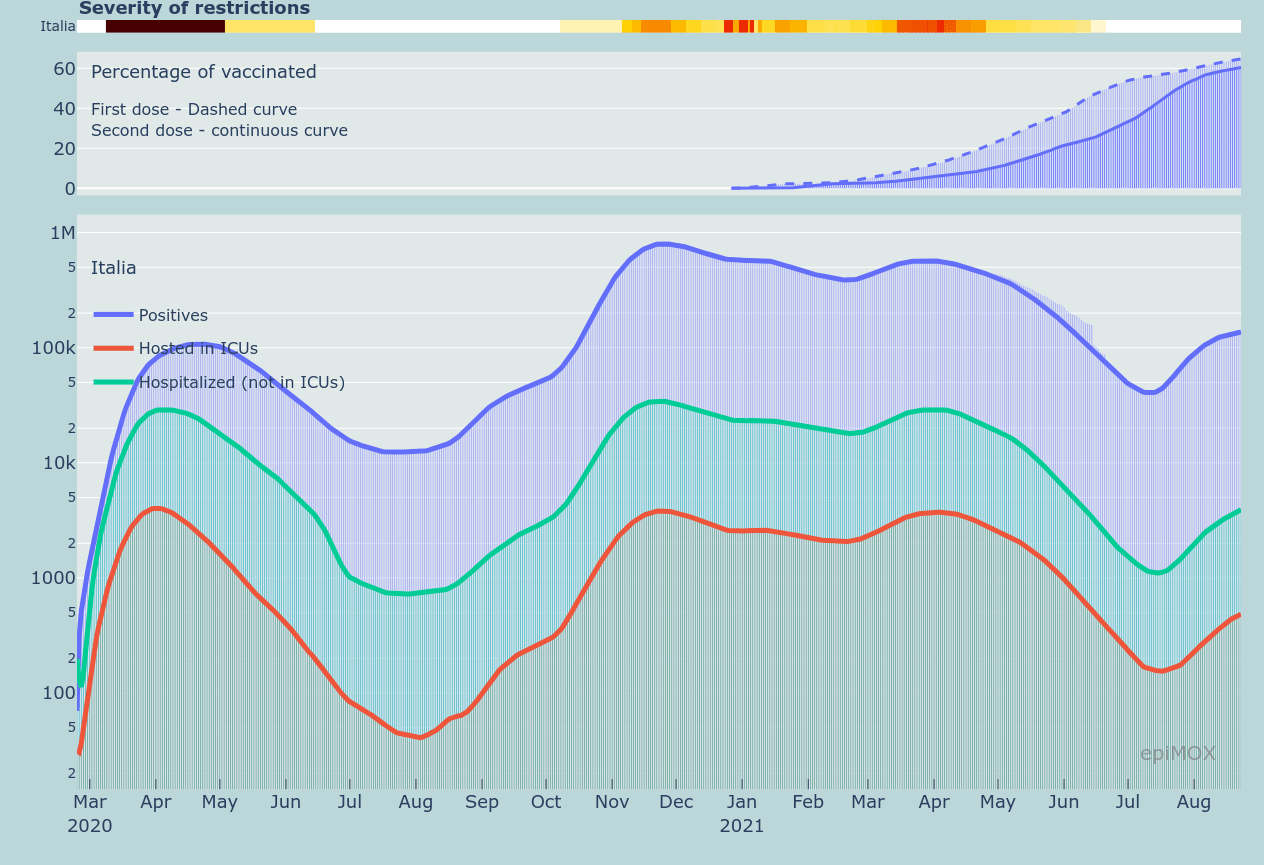
In particular, we have released the epiMOX dashboard (https://www.epimox.polimi.it/) [1] for the visualization and processing of COVID-19 data and simulation results finalized to forecast and scenario analyses (see Figure 1).
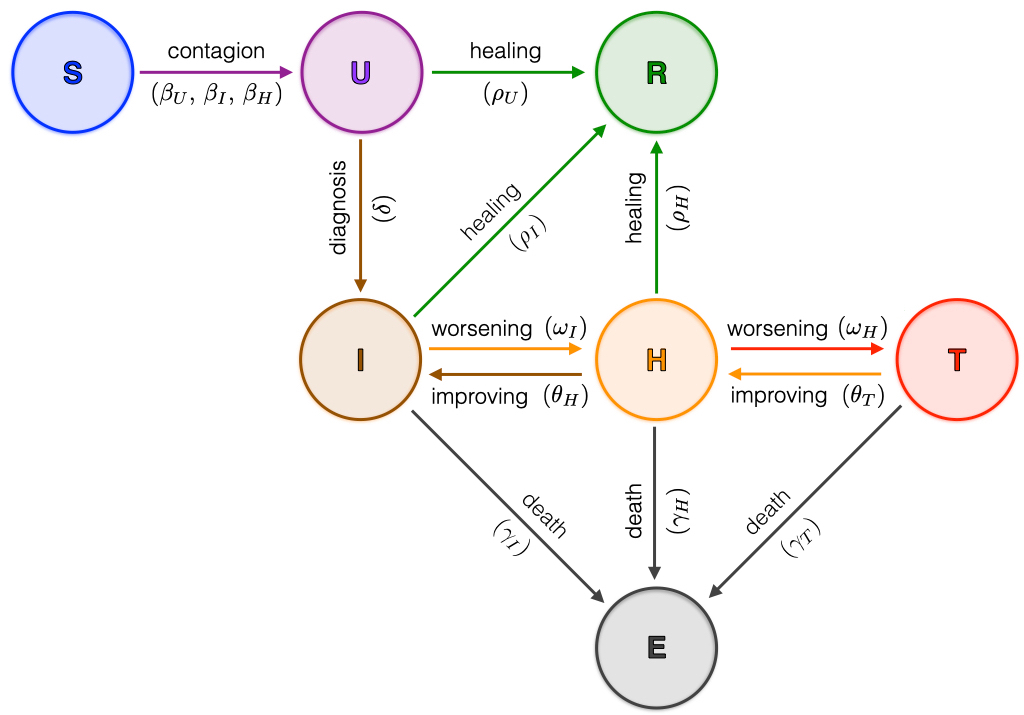
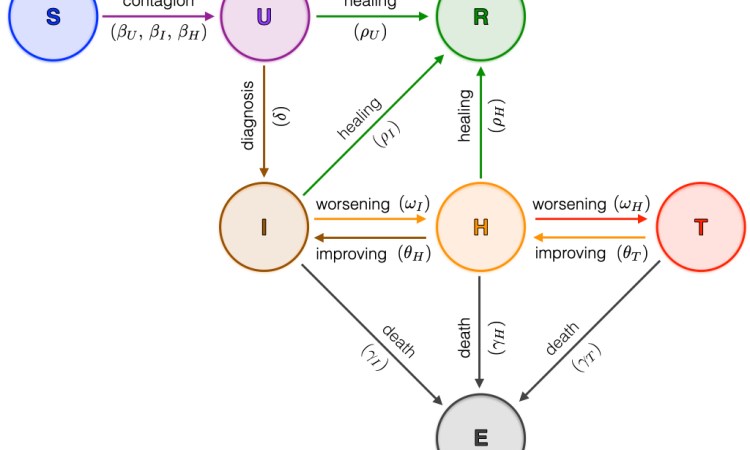
The simulations have been carried out based on a new epidemiological model named SUIHTER [2] from the names of the seven compartments that it comprises: susceptible uninfected individuals (S), undetected (both asymptomatic and symptomatic) infected (U), isolated (I), hospitalized (H), threatened (T), extinct (E), and recovered (R) (see Figure 2).
A distinctive feature of the new model is that it allows a one-to-one calibration strategy between the model compartments and the data that are daily made available from the Italian Civil Protection. The new model has been applied to the analysis of the Italian epidemic during the different outbreaks that occurred since February 2020. The epidemiological model SUIHTER has been used in a predictive manner to perform scenario analysis at the national and regional levels.
The dashboard is available at this link.
References
[1] Parolini, N, Ardenghi, G, Dede’, L, Quarteroni, A. A mathematical dashboard for the analysis of Italian COVID-19 epidemic data. Int J Numer Meth Biomed Engng. 2021;e3513. https://doi.org/10.1002/cnm.3513
[2] Parolini N, Dede’ L, Antonietti P F, Ardenghi G, Manzoni A, Miglio E, Pugliese A, Verani M, Quarteroni A. SUIHTER: A new mathematical model for COVID-19. Application to the analysis of the second epidemic outbreak in Italy, arXiv:2101.03369, 2021