Aoife Hurley CRT student
The fascination with postcodes and the popularity of certain postcodes is nothing new in Dublin. There is a long-standing theory that purchasers will pay more for a specific postcode – historically postcodes have been used as a wealth indicator and class status symbol, perhaps this belief is still held by individuals! For those not familiar with the postcode landscape of Dublin, Dublin is divided into 25 postcodes: D1 – D18, D20, D22, D24, D6W, North County Dublin, South County Dublin and West County Dublin. The river Liffey splits the county into north and south, with even-numbered postcodes south of the river and odd-numbered postcodes to the north. Nowadays, postcodes impact many areas of life including school catchment districts, hospital zones and local property tax.
properties are valued differently due to their postcode prompted our investigation into the impact of the ‘postcode effect’, chiefly, to what degree a given postcode potentially impacts a property’s price? Can using a more popular postcode, instead of your actual one, increase the resale value of your property?

We used data from January to November 2018 (inclusive), which was provided by 4PM Ltd., to conduct our analysis. The dataset had 5,208 property transactions for the whole County Dublin over this time period, with sale prices obtained from the property price register and descriptions from the original property listing.
In order to isolate how much of postcode value is driven by perceived desire, we first established the impact on value of attributes such as property type (apartment, house, duplex etc), energy rating, and individual house features (e.g. recently renovated, has parking or a big garden, etc.). There are a whole host of local amenities such as schools, transport links and nearby parks that go into the value of a property – we attempt to capture this through the use of a geospatial statistical model which enables us to estimate how much of the price per square metre is attributable to the GPS location of a property.
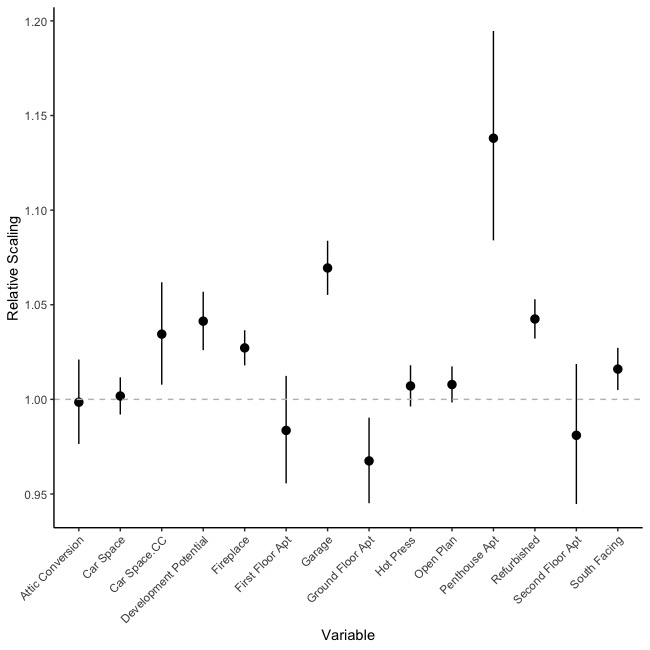
In Figure 2 we show the property features (e.g. South Facing) we use in our models with the y-axis providing the estimated effect of each, known as its relative scaling. The features shown are associated with the best fitting model. An estimated impact of 1 can be interpreted as the feature has no impact, lower than 1 indicates a reduction in value and greater than 1 an increase in value. For example, we estimate the premium for a renovated property to be between 3.2% and 5.3% over a non-renovated equivalent. Interestingly, we see a premium for parking within 5 kilometres from O’Connell bridge (Car Space.CC) in the order of 3.4%.
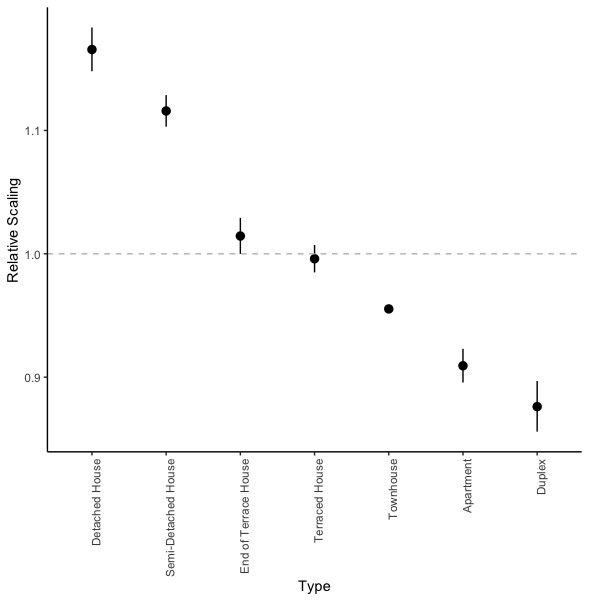
Property type has long been speculated to have an impact on the price, with different property types having different effects. Our statistical model allows us to examine the impact of property type on price per square metre while keeping all property attributes and features the same. In Figure 3, listing the property as a detached house has an estimated impact of 1.17, and for a semi-detached this is 1.12. As a result the premium for a detached house over a semi-detached equivalent would be 4%.
BER certificates were introduced in 2007 in Ireland. They indicate the energy performance of a house and are needed in the resale of residential housing, though some exemptions exist. We group the subcategories of the BERs together, i.e. ‘A1’ and ‘A2’ are grouped into ‘A’, ‘B1’,
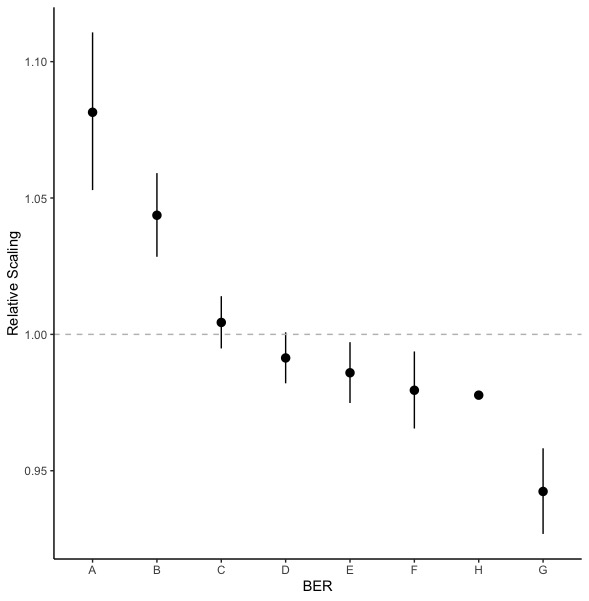
‘B2’, and ‘B3’ are grouped into ‘B’, etc.. ‘A’ is the highest rating and is the most energy efficient, while ‘G’ is the lowest rating and is the least energy efficient. In Figure 4, the x-axis shows the different ratings, with ‘H’ indicating exempt properties. Having an ‘A’ rated home has a relative scaling of 1.08 compared to the overall average effect of BER ratings. In contrast, a ‘G’ rating has an estimated impact of 0.94 compared to the average, reducing the price per square metre by 6%. For comparison, increasing the property from a ‘G’ to ‘A’ BER rating could increase the value by 13%.
Our first analysis of postcode effects used the postcodes that were listed on the property advertisement. These impacts are shown in Figure 5. We have shortened some of the postcode names on the x axis, so NCD is North County Dublin, SCD is South County Dublin, WCD is West County Dublin, D1 is Dublin 1 and so on. It is clear from this plot that the majority of south side postcodes (even numbers, shown in navy) have estimated impacts larger than 1, signifying postcodes add an additional premium per square metre over and above all other property attributes.
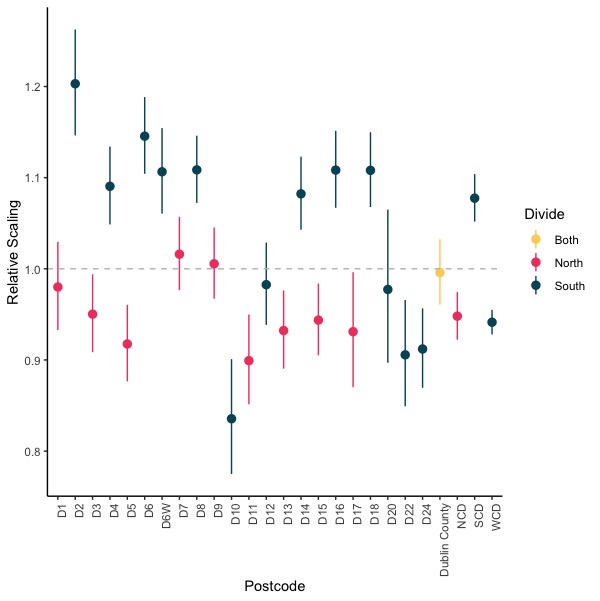
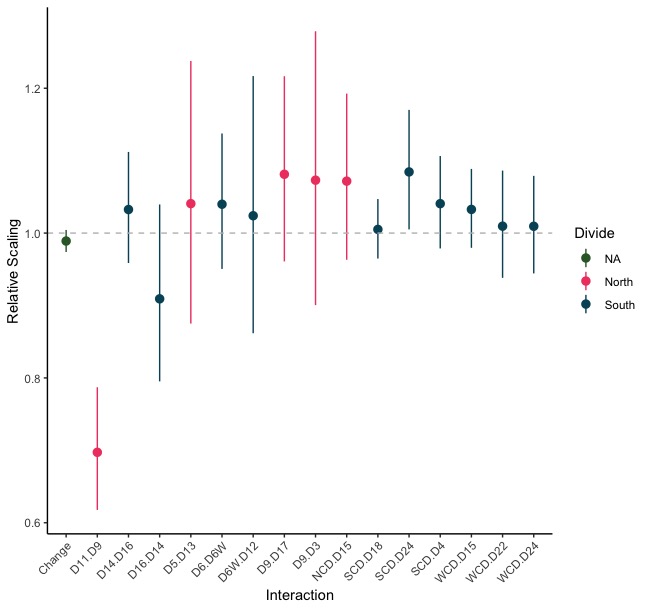
This, however, does not tell the full story. Our analysis showed some properties included the wrong postcode. Using GPS coordinates of the properties we confirmed and corrected all the postcodes for the properties we studied. 16% of properties studied changed postcode. We attempted to quantify the changes that appeared most often. In Figure 6, the x-axis shows the different postcode changes; ‘D11.D9’ can be interpreted as properties that were advertised as Dublin 11 but were actually in Dublin 9, ‘SCD.D24’ can be read as properties who were said to be in South County Dublin but are actually in Dublin 24, etc.. The 95% confidence intervals for these estimates are larger than any seen in the previous plots as there are a small number of transactions that fall into each category. In Figure 6, impacts larger than 1 show changes that have an additional premium associated with them. When we investigate the postcodes involved, this premium can be linked to claiming the property is in a neighbouring postcode with a higher median price. For example, our model predicts that if a property in Dublin 24, which correctly listed their postcode as D24 had a value of €250,000, the exact same property using the postcode South County Dublin would have an increased value between €253,000 and €293,000
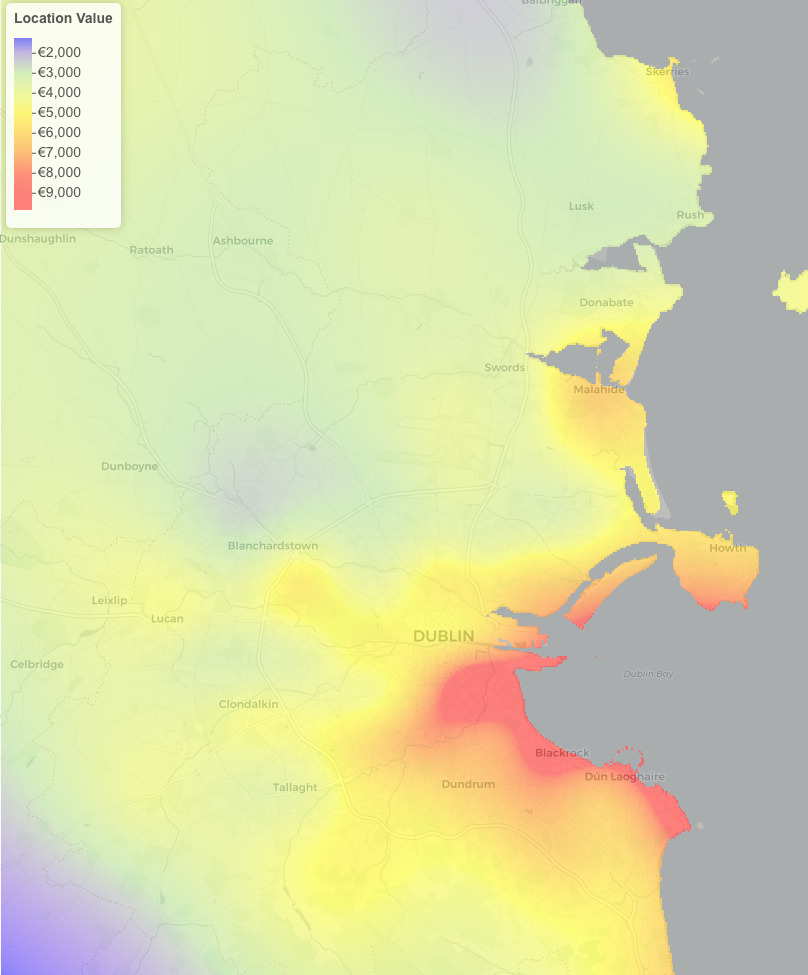
Importantly, we include the GPS coordinates of the property in our models, which allows us to include a value associated with the physical location of the property. We extend these values over the whole county, resulting in the surface map shown in Figure 7. We observe higher estimated values along the south coast and in areas with popular postcodes.