Eoin Walsh CRT student
In order to make forecasts about the weather, meteorologists make use of Numerical Weather Prediction (NWP) models. These models require real world data as inputs in order to make inferences about the near future weather. One such input is a land-cover map. Land-cover maps, in the domain of meteorology, describe any natural or man-made surface features which affect weather conditions through their influence on turbulence, radiative, heat and moisture fluxes in the atmosphere. As an example, trees and large buildings would have a large impact on horizontal surface winds when compared with the impact that grassland areas would have.
The current standard meteorological land-cover map is known as ECOCLIMAP-SG (ECO-SG). It is a global map, consisting of 33 different land-covers (see Figure 1). The map has a per pixel resolution of 300 X 300 metres. In the future, NWP models will become more resolute, and so a land-cover map of higher resolution will be required to supplement this. There have been some initial efforts made to produce higher accuracy, higher resolution maps on a national basis, however, in order for such improvements to be useful in a NWP context, the improvements must be universal in nature, otherwise artificial borders might be introduced into the overall land-cover map, which wouldn’t be ideal from a modelling perspective (imagine a situation where the Republic of Ireland had a map of higher resolution and accuracy than Northern Ireland).
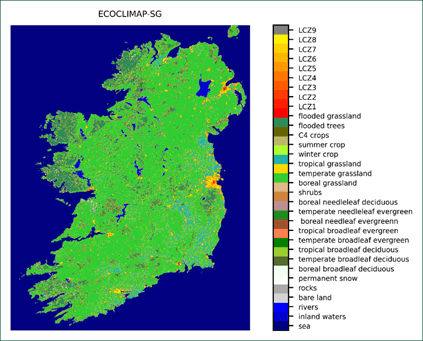
Figure 1: ECOCLIMAP-SG land-cover map for Ireland. It consists of 33 distinct land-covers.
The topic of Machine Learning (ML) has seen an increase in interest across domains in recent years due to improvements in ML methods, easier access to increased computing power, and, most importantly, a tsunami of data, be it accessible online or in house within organisations. Given all of this, a ML algorithm that could produce a land-cover map for Ireland was developed, in order to compare with ECO-SG, so as to see if ML could be a viable method to improve the accuracy and resolution of meteorological land-cover maps, whilst also offering a universal way of doing so.
The sub-category of ML that we focused on was Supervised ML. Supervised ML refers to the use of labelled datasets to train an algorithm that will then make predictions about unlabelled data. In this case, we wished to develop an algorithm that could make predictions about what land-covers are present in satellite images.
To train the algorithm, we made use of satellite images from the European Space Agency’s (ESA) Sentinel-2 satellite, and the European Environmental Agency’s (EEA) Coordination of information on the environment (CORINE) land-cover dataset. The CORINE dataset was used as its 2016 iteration is thought to be ~85% accurate, whilst it’s 2018 iteration is thought to be even more accurate. In the context of supervised ML, the dataset is our satellite images and the labels are the corresponding land-cover segments for each satellite image, derived from the CORINE dataset.
The CORINE dataset has a 3-tier labelling system. The primary level contains 5 labels, the secondary level contains 15 labels, and the tertiary label contains 44 labels. The scope of this work was to create 2 ML algorithms, one that would be able to label images using the primary labels, and the other that would do the same thing with the secondary labels. The tertiary labels were not used as this project was undertaken during a 12-week PhD internship, and so time was limited.
The Sentinel-2 segments and the corresponding CORINE segments used to train the ML algorithms can be seen in Figure 2. To the train the algorithms, the segments in Figure 2 were split into 120 X 120 pixel segments. Once the ML algorithms had been trained, a land-cover map for Ireland was created by passing 207,025 120 X 120 pixel segments of the island of Ireland and its surrounding waters, through both algorithms. The 2 maps produced were called the primary and secondary Ulmas-Walsh (UW) maps respectively.