For many years scientists have tried to understand the complicated mechanisms governing Earth’s climate. It is known to have always been changing under influence of multiple endogenous processes (e.g. volcanic activity) and exogenous factors (e.g. human influence). Astrophysicists hypothesise that some of the patterns noticed in climatological data can be related to activity of the Sun.
Changes in solar activity during the 11-year solar cycle manifest in various phenomena: number of sunspots observable, irradiance both within the visible spectrum and outside of it, solar flares and solar wind. Research articles suggest possible connections of this cosmic activity to cloud coverage on Earth, air temperature and precipitation, observed in river flows or measured directly.
This last feature of the climate — precipitation level and its relationship to Sun activity became a topic of interest for research conducted by Weronika Nitka, a student of the Applied Mathematics at the Faculty of Pure and Applied Mathematics at Wrocław University of Science and Technology (WUST), and Krzysztof Burnecki, professor at the same faculty. They aimed to use time series modeling to quantify the possible connection between average monthly precipitation in the United States area and monthly observed sunspot numbers, which are a direct indicator of the intensity of solar activity. The precipitation data was averaged across weather stations shown in the map below in order to reduce possible locally specific patterns.

As a preliminary step towards time series modeling, correlation analysis was conducted on raw and differenced data. Each month of the year was regarded separately in this step, knowing that rain- and snowfall differs throughout the year in the temperate climate zone. It was found that the correlation between precipitation in a given year and that year’s sunspot numbers is rather small. However, delaying the sunspot data in time (allowing for more complex processes to occur) revealed clearly periodic fluctuations, visible in the plots below. The period of these oscillations is equal to 11 years, i.e. the length of the solar cycle, and many of the correlations are statistically significant, especially during the mid-summer and mid-winter months. The results were mostly consistent between undifferenced and differenced time series, though of a slightly smaller significance for the latter.

The findings from this section were used to find the optimal delay for the sunspot numbers used as an exogenous variable in a time series model. Models of (differenced, to ensure stationarity) rainfall amounts were estimated with and without the use of solar activity information, and their performance in one-step-ahead forecasting was compared. The model chosen for the time series without the exogenous variable was an ARMA(p,q) model with p autoregressive and q moving average terms, defined as a stationary solution of the equation:
where 

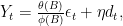
have no common factors. The model incorporating the appropriately delayed sunspot numbers was an ARMAX model, defined here as linear regression with ARMA residuals:
where the sequence 


Comparing the forecasts obtained from both models showed that the mean-squared error of ARMAX prediction is 1.8% lower than for the ARMA, and the Clark-West test for the equality of forecast accuracy confirmed the significance of this improvement on the significance level of 0.1. Therefore it can be concluded that there exists a statistically significant relationship between precipitation and solar activity, and incorporating additional information in the model may lead to slight improvement in the forecasts.
[1] W. Nitka, K. Burnecki (2019) “Impact of solar activity on precipitation in the United States”, Physica A: Statistical Mechanics and its Applications Volume 527, 2019, 121387.
By Weronika Nitka, student, and Krzysztof Burnecki, Faculty of Pure and Applied Mathematics, Wrocław University of Science and Technology